Sailors' Society/ICMA
ShipVisitor
Digitising the collection of reports from chaplains & ship visitors distributed around the globe.
Sailors' Society is a UK based charity that works around the world with merchant seafarers. One of its primary activities is the placement of chaplains in ports around the world providing support to seafarers away from home.
Historically, chaplains were required to report back to headquarters on a monthly basis to give an account of their activities. They would detail any issues they'd run into and any stand out stories that they'd been part of. This would be completed in the form of a written report, emailed or posted once the chaplain had chance to complete it.
We were approached to digitise the workflow, to improve the efficiency of the entire process and to make it easy to scale.
We created a cloud-based system to collect reports in real time from distributed workers all across the world. At one end of the system is a mobile app for easy data capture and at the other a powerful reporting dashboard. To ensure there was buy-in before we made the switch, we designed all aspects of the system in consultation with those that would eventually be using it.
The system also integrated with a real time vessel tracking data provider to enable accurate scheduling of visits.
Switching from long form reports to short actionable messages, enabled chaplains to make status updates in the present as opposed to in retrospect.
Reports, photos and vessel check-in's feed into the system from wherever the chaplain is based.
 The Innovative Technology Award
 The Innovation Award - Technology
The Shipvisitor App has dramatically changed the reporting requirements of our chaplains work in the Society, and freed them up to maximise ship visitation and provide much needed welfare for seafarers.
Sandra Welch - Deputy CEO @ Sailors’ Society
As part of familiarising ourselves with the current paper based workflow, we conducted a number of interviews and workshops with all the various roles involved. This helped us empathise with those who would use what we built and enabled us to fight for these users' pain points during the design process. Knowing that they'd been listened to and weren't going to have a new process forced upon them without consultation, helped build trust with all the stakeholders of the project.
During this discovery phase we identified a number of key users who would be critical to the end system's success:
Through a series of discovery workshops we gained significant insight into these key users' frustrations that helped craft the best solution.
Reporting and analysis should be done in real-time.
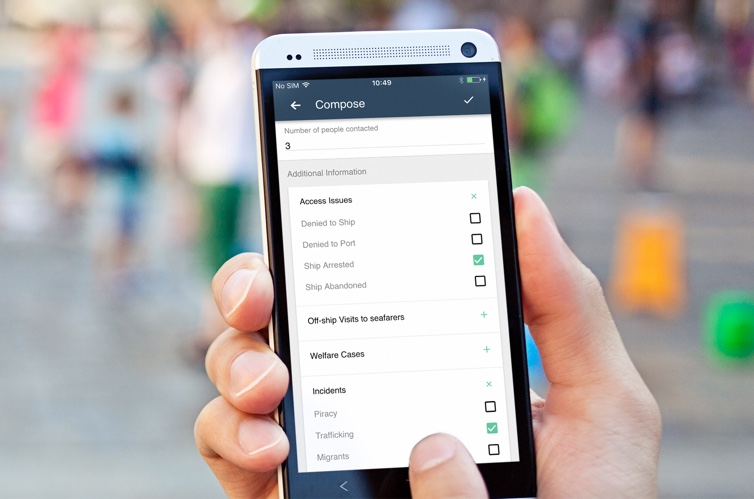
Must capture a mix of qualitative and quantitive data.
Photos were as important as text.
Must be capable of working offline or in poor data connectivity areas.
Must be able to access live vessel data and have the ability to build a schedule.
The app and dashboard have made a real difference to my work. I can now see at a glance what our chaplains are doing and I can be far more responsive to them as issues arise. Our chaplains are all over the world, but this software seems to have brought them all so much closer to us.
Barbara Kidd - Chaplaincy Support Officer @ Sailors’ Society
Based on the gathered requirements we began a phase of design work. We looked to design a system that would solve the problems of each of the key users, in as intuitive a way as possible.
The system architecture was designed at this stage, including an app for gathering data in the field and a dashboard for analysing reports. We investigated the feasibility of the various integrations we would need for live ship data and provided estimated costs for the ongoing infrastructural costs.
Prototypes were created of both the app and dashboard interfaces, which we then tested with various users to ensure that their key tasks could be completed with ease. Using feedback we gathered through our usability observations we were able to refine the design of both to better communicate how each task should be completed.
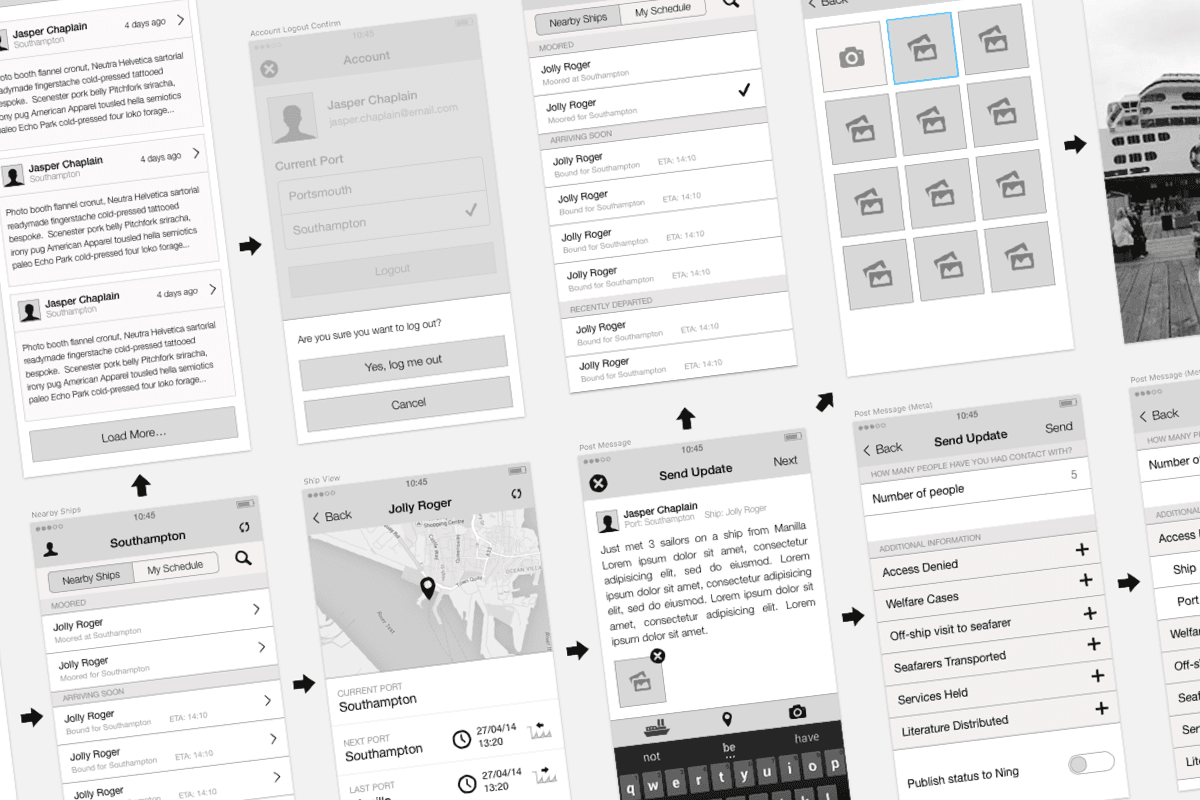
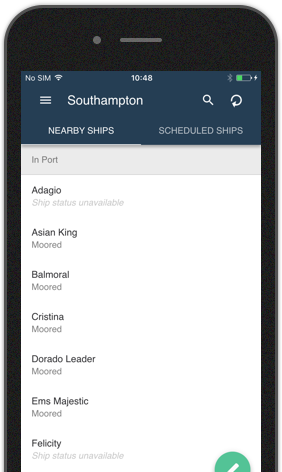
Initially an Android-only app, we decided to take a Material-esque route for the visual aesthetic. This created an uncomplicated, modern and intuitive interface. We were also able to take advantage of the Floating Action Button pattern, found in Material Design, to provide quick access to the app's primary call to action; creating a status.


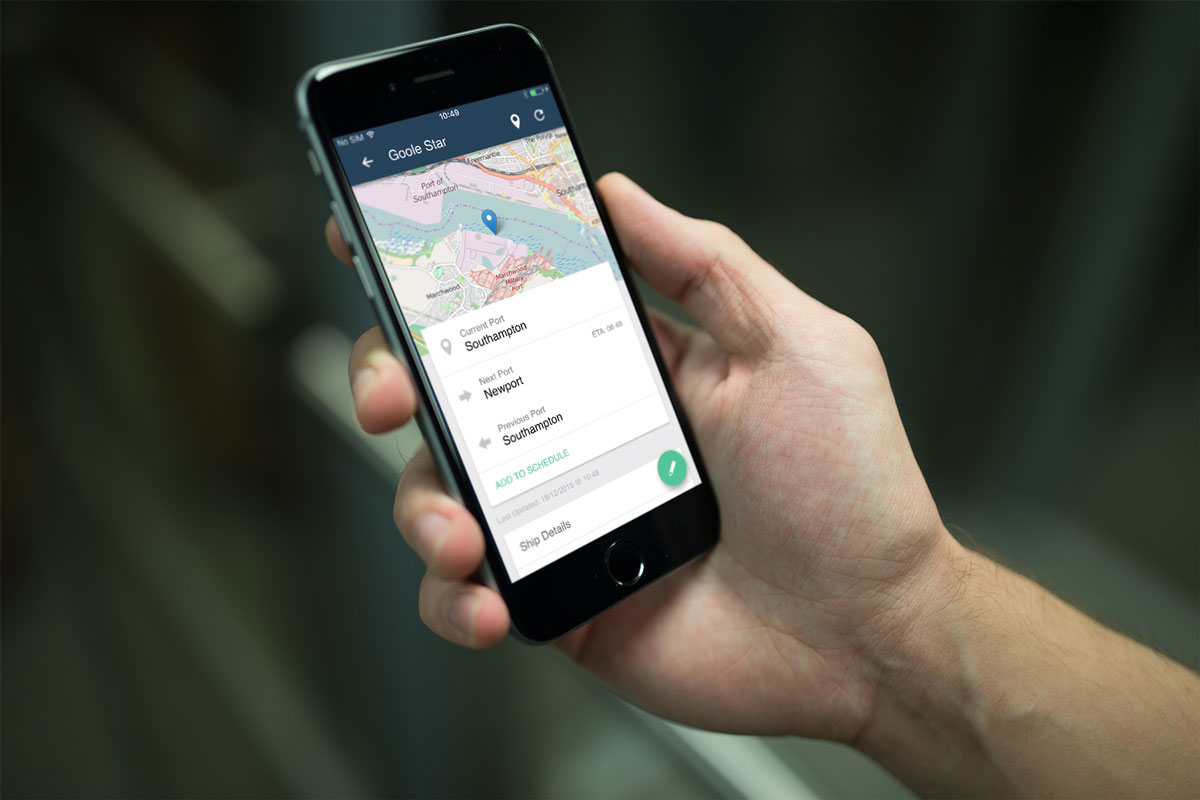
Information about vessels and their locations was an important feature for the success of the project. Vessels are fitted with an Automatic Identification System (AIS) that can be used for identification and location. This AIS data is however not readily available in a format that would be useful, so we spent some time investigating existing options that could provide this data. The primary organisation providing AIS data as a web service is Marine Traffic and after a feasibility exercise we decided to utilise their API feed.
We built an integration that would provide the ShipVisitor system real-time data fed from the MarineTraffic API, which allowed us to achieve the following within the app:
We were able to capture the vessel's current GPS location and also details about its journey. Which port had it left and which was it heading to next?
This allowed for ship visits to be scheduled ahead of time.
Working with Rareloop was a pleasure, they really seek to understand your business and culture so they can work in support of the project and help deliver and exceed our expectations.
Paul Langham - Project Consultant @ Sailors’ Society
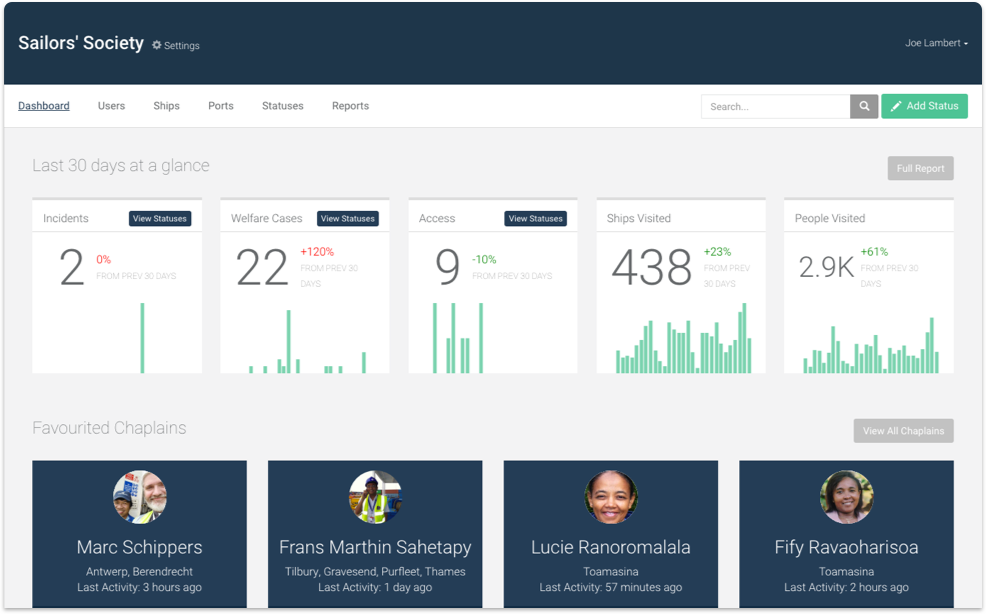
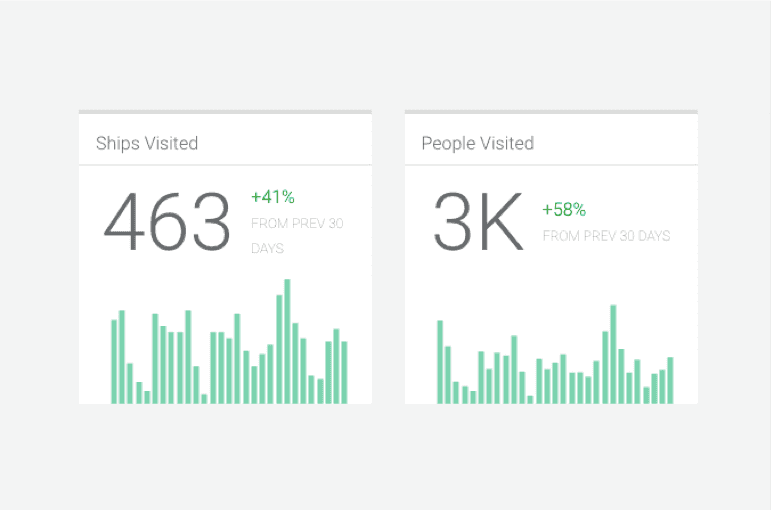
The ease with which chaplains could enter data was not the only problem the system had to solve. We also had to make it possible for back office staff to interrogate and consume the data individually and in aggregate.
We built a reporting system on top of the database of chaplain reports that allowed for month by month totals for all captured meta fields. This system would allow for reports to be generated for an entire organisation or to be filtered by:
Unlike the previous paper-based system, reporting was now real-time allowing for up to the minute data to be automatically compiled whenever it is required and exported for Excel, a CSV or PDF.
We also built an advanced facetted browser interface, helping back office staff find individual chaplain reports that would be useful for marketing purposes. This enabled filtering by all facets of data captured against a report, as well as whether or not a photo was included, who the author was and what port/ship it was attached to.
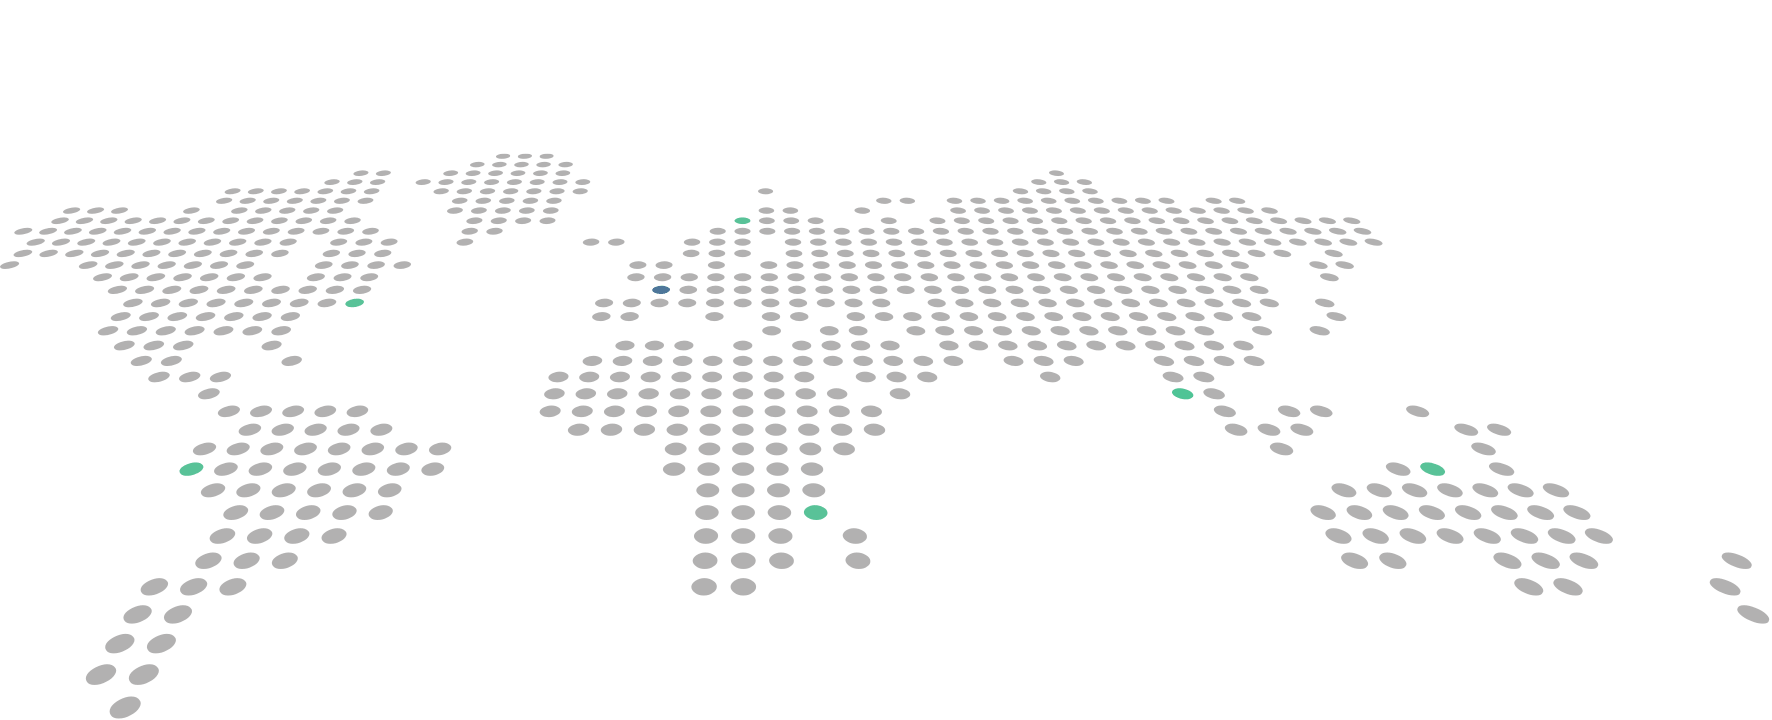
Sailors' Society initially rolled the system out for its worldwide chaplaincy workforce. Following a hugely successful pilot a further 27 member organisations of the maritime association ICMA joined the platform.
We designed the system to enable re-use of ship and port data across the platform. However, any reports captured by a user in one organisation were not accessible to any users in another organisation's account.
A number of flexible user roles were also created to allow member organisations to self manage their accounts. This gave reporting access to those that require it whilst adding lower privileged chaplain users as they were needed.
 Laravel
 HTML5
HTML5 Cordova
