Rapid Oil Spill Surveillance
- Discovery
- Prototyping
- Functional Design
- Visual Design
- Development
A Rapid Oil Spill Surveillance (ROSS) Tool for SpillConsult & BP. Enabling aerial observers to easily collect GPS referenced data on a moving map, automate calculation and produce fast standardised reports.
The Challenge
SpillConsult are a UK based consultancy that specialise in the training and delivery of Aerial Surveillance for oil spill incidents. Whilst trained observers are required to complete the task, much of the calculations around estimating the volume of oil on the water can be done computationally. Variations between practitioners can also lead to differences in how the observations are reported, making comparisons difficult.
Aerial surveillance is done under a relatively unique setting and as such any tool introduced would need to be easily used at altitude, in a small aircraft, without internet connection.
What We Did
We designed and built a tablet app that enabled observers to capture information about oil slicks and associated activity on an offline cached map. The app provided custom work-flows for a number of tasks, real-time calculations of oil volume estimations and a standardised PDF report output.
Through a consultative discovery phase we identified all the scenarios under which this tool would be used. With this knowledge we designed an un-opinionated app experience that would allow observers to quickly access the right area of the app regardless of whether they were pre, during or post flight.
Custom Map UI
As most oil spills occur at sea, the app could not rely on land based map tiles alone. Aerial observers would need a way to orient themselves within the app even when far away from land. We took advantage of the Open Sea Map nautical map tiles and overlaid them on top of the more traditional land based Open Street Map, so that both bases were covered.
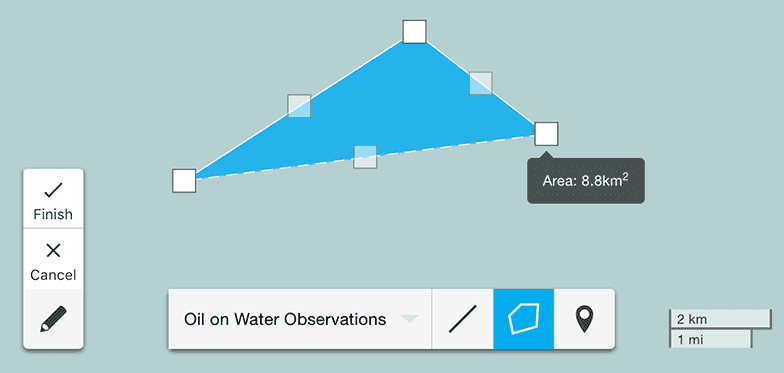
A critical feature of the app was to enable points of interest to be marked on the map in real-time. We built a custom User Interface (UI) to enable an observer to add their choice of markers, lines or polygons and assign them to a specific observation task. Whilst complex to build, the interaction was simple to use and provided a powerful way to report on and monitor the clean-up of oil slicks.
We also built in real-time flight path tracking, capturing both positional and altitude based data. By drawing this on the map we were able to provide context for specific POV's based on where the observer had travelled during a flight.
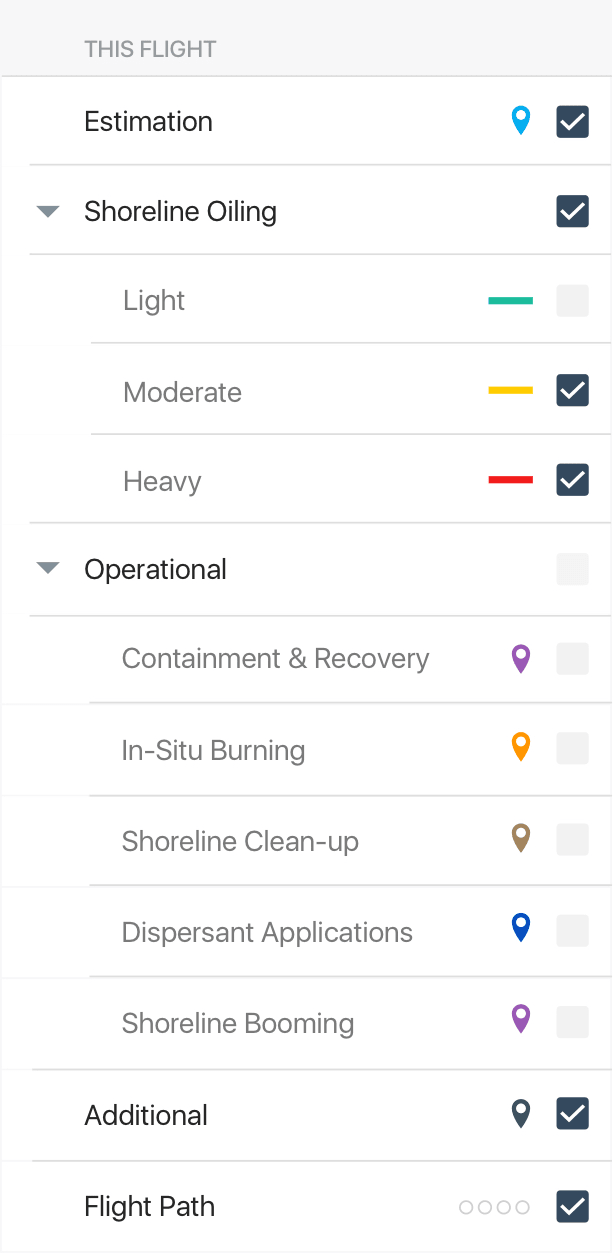
As each POV was categorised, we designed a UI to allow an observer to toggle which categories/layers they wished to view at any one time. This allowed observers to capture as much data as they required without the fear of the interface being cluttered when they focused on a specific task.
Work Flow & Calculations
Marking the presence and location of a point of interest (POV) is only part of what observers would need to know. An observer could also add notes and photos to each POV and we built a custom work-flow for gathering additional pertinent information depending on the category assigned.
For oil slick POV's we provide a bespoke tool for estimating the quantity of oil against a number of standard measures (BONN, ITOPF & NOAA). When a polygon was drawn the tool would also estimate the total area of the slick for you, reducing the number of steps required. Oil volume calculations were automated in real-time, with a simple set of sliders to assign the different proportions within a slick.
Other bespoke tools were provided for each other category, allowing for quick classification of POV's. This efficient information gathering provided rich, clean data that made for actionable reporting.


PDF Report Generation
Reporting was the primary reason that GPS based observational information was gathered. We built a custom PDF rendering engine to produce a standardised summary report of all findings within a flight. As well as a strategic overview, the report contained specific sections for each of the categories of POV that were observed. Any attached images were embedded along with screenshots of relevant POV's on the map.
The custom rendering engine worked purely on the device without the need for an internet connection or third party server. Once created, the PDF could be shared to any other PDF capable app on the device or sent via email.

Data Export
In addition to being able to generate a PDF report, the app also enabled the gathered data to be exported in a number of ways. The list of POV's could be exported as a CSV file or the more Geo focused KML format. This allowed observers to load a flight into Google Earth, a tool that is commonly used as part of aerial surveillance observations.
We also built a custom data format, so that flights could be exported and sent to fellow observers. This enabled an observer to send a file to a colleague which they could then load within the app on another device, or store remotely as a backup.


This app has the potential to make a huge impact to aerial surveillance teams - capturing oil spill details quickly, consistently and accurately; while equipping the incident management team with crucial information. The time that this app will save, and the practicality it delivers, during an oil spill cannot be understated. It has been a pleasure to work with Rareloop on this project – they were always open to dialogue and full of great ideas for the User Experience! We’ll be back!
Dr. Siân Herrington - Consultancy Services Lead
Offline Map Caching
Given the nature of aerial surveillance work, an internet connection is not something that can always be relied upon having. For that reason, we implemented a map caching feature that allowed observers to specify an area to save on their device.
Always Available Resources
An aerial surveillance observer is a highly trained individual but there is a lot of reference information that they may need to draw upon before, during or after a flight. We designed an interface that would allow for such resources to be shown at any point during the app. No matter what task an observer was undertaking, should they need additional information, they could pull up the reference tray and retrieve it.
We also deep linked to areas of the resources at the times they would need it most. For example, when an observer was estimating oil volumes, the app provided one touch access to documentation for the currently selected standard measure (e.g. BONN, ITOPF or NOAA).
Collaborative Beta testing with the client
We take a 'release early and often' approach when building software for a client. By making pre-release beta versions available to the client, we were able to iterate & refine parts of the UI without having a large impact on the projects lead time. The project also benefited from the clients expert domain knowledge from an early stage which ensured that difficult to spot bugs and errors were caught quickly. The additional transparency also helped set expectations around project progress and encouraged a collaborative partnership instead of the more segregated client/supplier relationship.
Technology Used
 HTML5
HTML5 Angular
 Cordova

